Largest solar farms in Australia: AEMO July 2026
Wellington North Solar Farm (436.8 MW AC) is the largest solar farm AEMO classes as in service. Greater Geelong Energy Hub - KCI (2,000 MW AC) leads on reported nameplate capacity but is only publicly announced.
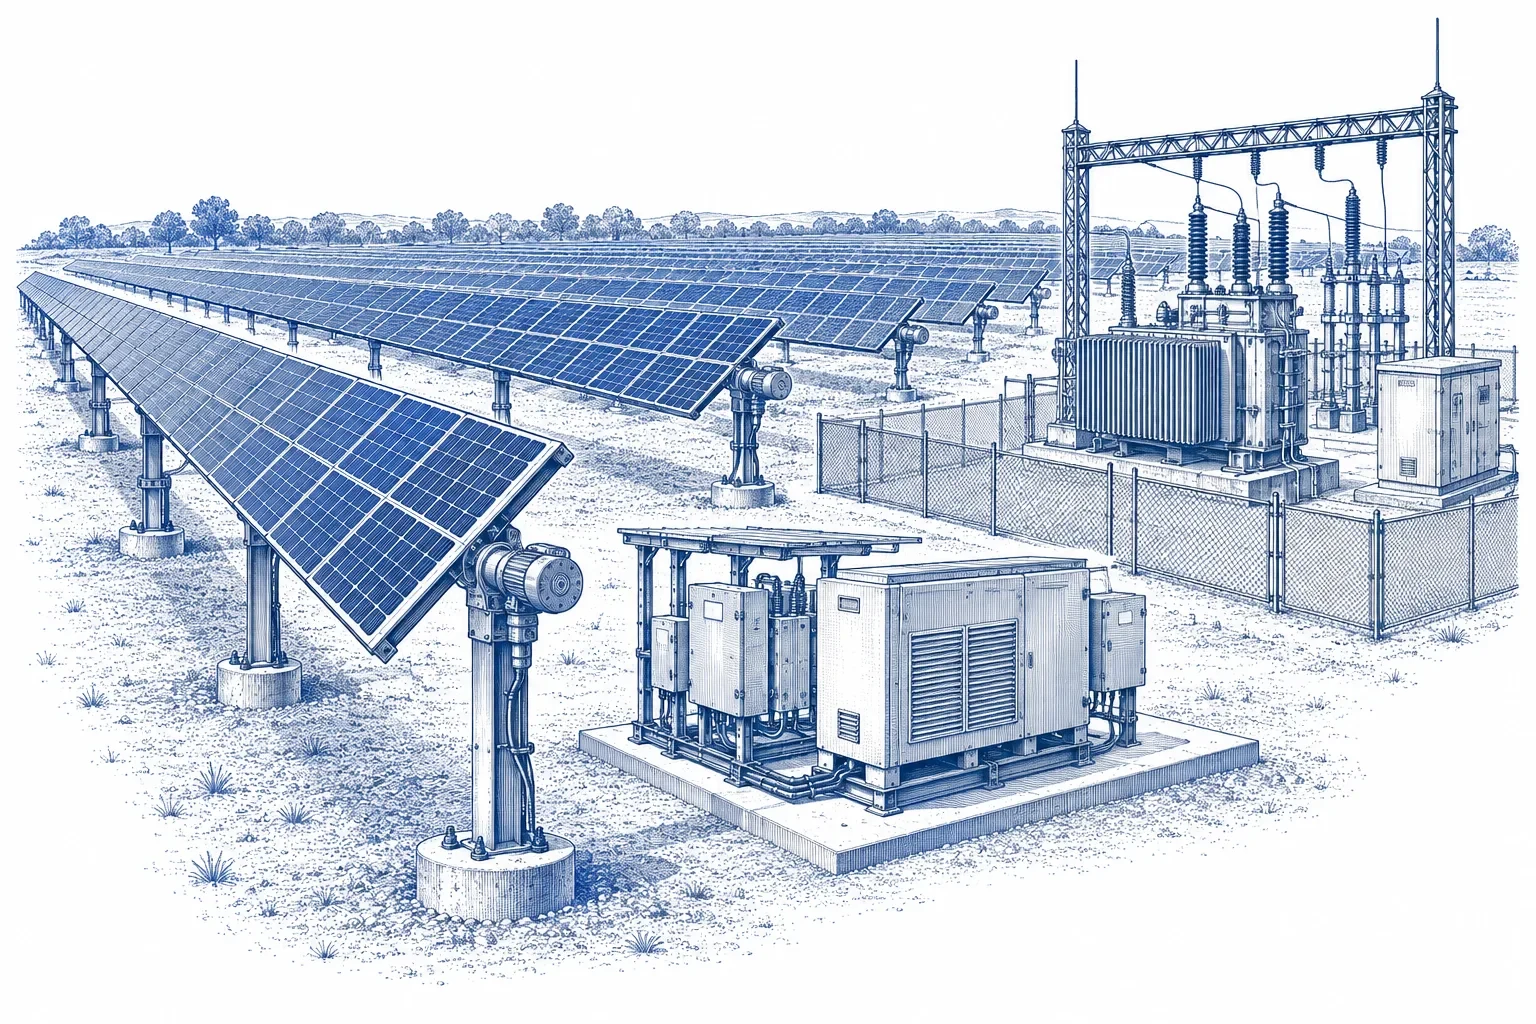
Wellington North Solar Farm in New South Wales is the largest solar farm in service on Australia’s National Electricity Market. AEMO’s 31 July 2026 Generation Information release records 436.8 MW AC of in-service capacity there.1 The largest entry of any status is Greater Geelong Energy Hub - KCI in Victoria, at 2,000 MW AC. AEMO classes it as Publicly Announced, so none of it is built.1
None of the 25 largest entries is in service. The first in-service site sits at rank 34.1
TL;DR
- Four solar sites of 400 MW AC or more are in service: Wellington North (436.8), Western Downs Green Power Hub (400.8), New England (400) and Stubbo (400).1
- Most listed solar capacity is still a proposal. Of 74,865.7 MW AC in the release, 11,463 MW (15.3%) is in service and 53,228.7 MW (71.1%) is Publicly Announced.1
- New South Wales leads on operating capacity with 5,458.3 MW AC in service. Queensland leads on total reported capacity with 29,994.6 MW AC.1
- Western Downs Green Power Hub’s claim to be the largest operating solar farm rests on a 460 MWp DC figure.2 On AEMO’s MW AC field it ranks second.1
- In-service solar capacity rose 424.6 MW AC between the April and July 2026 releases.1
- The release covers the five National Electricity Market states. Solar farms in Western Australia and the Northern Territory sit outside the ranking.1
How this ranking was built
Glamdring Research ranks one field from one release, under its published research standard.
- Source: AEMO, NEM Generation Information, July 2026, released 31 July 2026. File
nem-generation-information-july-2026.xlsx, sheet Generator Information.1 - Field: Aggregated Nameplate Capacity (MW AC), which is the reported nameplate capacity (MW AC) of each generating unit.1
- Inclusion: rows with Technology Type Solar PV.
- Merge: generating-unit rows that share a site name and region are summed into one site.
- Exclusion: rows with status Withdrawn.
- Result: 350 solar sites in Queensland, New South Wales, Victoria, South Australia and Tasmania.1
- Operating capacity: AEMO’s In Service and Announced Withdrawal classes. Announced Withdrawal marks an operating plant with a closure announced. Every other class counts as not yet operating.
- Ties: sites with the same figure are listed alphabetically.
AEMO records each figure. That is a registry figure, not a measured output. The tables show the top 25 rows of each ranking, with figures exactly as the release gives them.
Which are the largest solar farms in Australia?
Greater Geelong Energy Hub - KCI in Victoria is the largest solar site in AEMO’s July 2026 release, at a reported 2,000 MW AC. Texas BESS in New South Wales follows at 1,764 MW AC, then Sunshine Energy Solar Farm in Queensland at 1,500 MW AC. All three are Publicly Announced. So are 23 of the 25 largest sites.1
| Rank | Site | State | AEMO status | Nameplate capacity (MW AC) |
|---|---|---|---|---|
| 1 | Greater Geelong Energy Hub - KCI | Victoria | Publicly Announced | 2,000 |
| 2 | Texas BESS | New South Wales | Publicly Announced | 1,764 |
| 3 | Sunshine Energy Solar Farm | Queensland | Publicly Announced | 1,500 |
| 4 | Upper Calliope Solar Farm (side A) | Queensland | Publicly Announced | 1,100 |
| 5 | Glenroy Hybrid Facility - Solar And BESS | Queensland | Publicly Announced | 1,000 |
| 6 | Cobbora Solar Farm | New South Wales | Publicly Announced | 818.4 |
| 7 | Bulli Creek Solar Farm | Queensland | Publicly Announced | 774.9 |
| 8 | North Burnett Renewable Hub - Solar | Queensland | Publicly Announced | 700 |
| 9 | Sandy Creek Solar Farm | New South Wales | Anticipated | 700 |
| 10 | Three Rivers Solar Farm | Queensland | Publicly Announced | 700 |
| 11 | Tallawang Solar And BESS | New South Wales | Publicly Announced | 672 |
| 12 | Birriwa Hybrid | New South Wales | Publicly Announced | 600 |
| 13 | Running Creek Solar and BESS | Queensland | Publicly Announced | 600 |
| 14 | Goulburn River Solar Farm And BESS | New South Wales | Committed | 588 |
| 15 | Eurimbula Solar Farm | Queensland | Publicly Announced | 562.8 |
| 16 | Bulli Creek Solar Farm (Trina) | Queensland | Publicly Announced | 550 |
| 17 | Beebo Solar Farm - KCI | Queensland | Publicly Announced | 528 |
| 18 | TUMMAVILLE Hybrid Facility- Solar And BESS | Queensland | Publicly Announced | 500.5 |
| 19 | Burdekin Solar Farm - KCI | Queensland | Publicly Announced | 500.4 |
| 20 | Robertstown Solar | South Australia | Publicly Announced | 500.4 |
| 21 | Bungaban Solar Farm - KCI | Queensland | Publicly Announced | 500 |
| 22 | Croydon Hybrid Facility - Solar And BESS | Queensland | Publicly Announced | 500 |
| 23 | Mackenzie River Solar Farm | Queensland | Publicly Announced | 500 |
| 24 | Melbourne Solar Farm and BESS - KCI | Victoria | Publicly Announced | 500 |
| 25 | Merriwa Solar Farm and BESS | New South Wales | Publicly Announced | 500 |
Source: AEMO NEM Generation Information, July 2026, field Aggregated Nameplate Capacity (MW AC), solar PV rows summed by site.1
Two entries in the top 25 have moved past announcement. Sandy Creek Solar Farm (700 MW AC) is Anticipated. Goulburn River Solar Farm And BESS (588 MW AC) is Committed.1 Queensland holds 15 of the 25 places. New South Wales holds seven, Victoria two and South Australia one.
Texas BESS carries a battery name, yet the release classes its 1,764 MW AC as solar PV. The ranking reports it as published. Many other names include BESS or Hybrid, and for every one of them the figure counts only the rows AEMO classes as solar PV.1 Battery capacity is ranked separately in Australia’s largest battery storage sites.
Which is the largest solar farm operating in Australia?
Wellington North Solar Farm in New South Wales is the largest solar farm AEMO classes as in service, at 436.8 MW AC in the 31 July 2026 release. Western Downs Green Power Hub in Queensland is second at 400.8 MW AC. New England Solar Farm and Stubbo Solar Farm, both in New South Wales, tie for third at 400 MW AC each.1
| Rank | Site | State | In-service capacity (MW AC) |
|---|---|---|---|
| 1 | Wellington North Solar Farm | New South Wales | 436.8 |
| 2 | Western Downs Green Power Hub P/L | Queensland | 400.8 |
| 3 | New England Solar Farm | New South Wales | 400 |
| 4 | Stubbo Solar Farm | New South Wales | 400 |
| 5 | Aldoga Solar Farm | Queensland | 387.8 |
| 6 | Culcairn Solar Farm | New South Wales | 349.6 |
| 7 | Walla Walla Solar Farm | New South Wales | 304.3 |
| 8 | Wollar Solar Farm | New South Wales | 280 |
| 9 | Darlington Point Solar Farm | New South Wales | 275.4 |
| 10 | Avonlie Solar Farm | New South Wales | 254.1 |
| 11 | Limondale Solar Farm 1 | New South Wales | 230 |
| 12 | Sunraysia Solar Farm | New South Wales | 228.8 |
| 13 | Woolooga Solar Farm | Queensland | 222.5 |
| 14 | Columboola Solar Farm | Queensland | 217.2 |
| 15 | Wellington South Solar Farm | New South Wales | 216.5 |
| 16 | Kiamal Solar Farm - Stage 1 | Victoria | 199.5 |
| 17 | Carwarp Solar Farm (CWSF) | Victoria | 186.2 |
| 18 | Edenvale Solar Park. | Queensland | 180 |
| 19 | Finley Solar Farm | New South Wales | 162.4 |
| 20 | Suntop Solar Farm | New South Wales | 158.4 |
| 21 | Coleambally Solar Farm | New South Wales | 150.3 |
| 22 | Daydream Solar Farm | Queensland | 150.1 |
| 23 | Bluegrass Solar Farm | Queensland | 148 |
| 24 | Sun Metals Corporation Solar Farm | Queensland | 143 |
| 25 | Bungala One Solar Farm | South Australia | 135 |
Source: AEMO NEM Generation Information, July 2026, in-service capacity in the Aggregated Nameplate Capacity (MW AC) field.1
The operating leaders cluster tightly. Five sites sit between 387.8 and 436.8 MW AC. The list then drops to Culcairn Solar Farm at 349.6 MW AC.1 New South Wales holds 14 of the 25 places, Queensland eight, Victoria two and South Australia one. ACEN Australia is the only owner named twice, for New England and Stubbo.1
The largest operating site is about a fifth the size of the largest proposal. Wellington North’s 436.8 MW AC is 21.8% of the 2,000 MW AC listed for Greater Geelong Energy Hub - KCI.1
The Queensland Government called Western Downs Green Power Hub Australia’s largest solar farm on 5 April 2023, at 400MW, as panel installation finished.3 AEMO’s July 2026 release now records a larger site in service.
How much solar capacity does each state have?
New South Wales has the most operating solar capacity in AEMO’s July 2026 release, at 5,458.3 MW AC in service. Queensland has the most once proposals count, at 29,994.6 MW AC across all statuses. Queensland’s listed capacity is nearly eight times its in-service capacity. For New South Wales the multiple is just under five.1
| State | Sites (all statuses) | Reported capacity, all statuses (MW AC) | In service (MW AC) | Share of state capacity in service |
|---|---|---|---|---|
| Queensland | 118 | 29,994.6 | 3,772.7 | 12.6% |
| New South Wales | 135 | 26,714.1 | 5,458.3 | 20.4% |
| Victoria | 54 | 10,982 | 1,512.1 | 13.8% |
| South Australia | 39 | 5,910.8 | 719.9 | 12.2% |
| Tasmania | 4 | 1,264.2 | 0 | 0% |
| NEM total | 350 | 74,865.7 | 11,463 | 15.3% |
Source: AEMO NEM Generation Information, July 2026. Shares computed by Glamdring Research.1
New South Wales holds 47.6% of the in-service solar capacity in the release. Queensland holds 32.9%.1 Site counts include every status, so they count proposals alongside operating farms. Tasmania lists four sites and 1,264.2 MW AC, with nothing in service.1
Western Australia and the Northern Territory don’t appear, because the release covers the National Electricity Market.
How does AEMO define the capacity figure?
AEMO’s capacity figure for a solar site is its Aggregated Nameplate Capacity (MW AC), taken from the Generator Information sheet of the Generation Information release. MW AC is the alternating-current rating. The figure records a site’s rated size. It doesn’t record the electricity the site generates.1
Each site also carries an AEMO status. The July 2026 release splits solar capacity like this:
| AEMO status | Solar capacity (MW AC) |
|---|---|
| In Service | 11,463 |
| In Commissioning | 1,707.3 |
| Committed | 1,356.1 |
| Committed* | 970.1 |
| Anticipated | 6,140.4 |
| Publicly Announced | 53,228.7 |
Source: AEMO NEM Generation Information, July 2026.1
The in-service ranking leaves out the 1,707.3 MW AC In Commissioning. A site in that class can already be exporting power. Western Downs Green Power Hub was exporting more than 350MW in April 2023, before its final testing and commissioning phase began.3 The in-service ranking is therefore conservative. The release separates Committed from Committed*, and the tables use AEMO’s labels unchanged.
Why do other published figures disagree?
Published sizes for the same solar farm disagree because sources mix units and boundaries. Some quote DC panel capacity in MWp where AEMO quotes MW AC. Some quote a whole project where AEMO records separate entries. Glamdring Research ranks on AEMO’s MW AC field alone, so every site carries one unit from one registry on one date.
| Site | AEMO July 2026 (MW AC) | Other published figure | Published by |
|---|---|---|---|
| Western Downs Green Power Hub | 400.8 | 460 MWp2 | The project’s website |
| Western Downs Green Power Hub | 400.8 | 400MW3 | Queensland Government, 5 April 2023 |
| Darlington Point Solar Farm | 275.4 | 333 MW4 | Blackridge Research |
| Darlington Point Solar Farm | 275.4 | 275 MWac, 333 MWp5 | Wikipedia |
| Sunraysia Solar Farm | 228.8 | 255 MWp4 | Blackridge Research |
| Walla Walla Solar Farm | 304.3 | 300 MWac6 | FRV Australia, 1 October 2025 |
| Limondale Solar Farm 1 | 230 | 314 MWac4 | Blackridge Research |
| Bungala One Solar Farm | 135 | 275 MW, two subprojects4 | Blackridge Research |
AEMO figures: NEM Generation Information, July 2026.1
MWp is a DC rating. Wikipedia’s list of large Australian solar projects carries separate columns for nameplate capacity in MWac and DC capacity in MWp.5 At Darlington Point the two figures are 275 and 333. The AC figure matches AEMO’s 275.4 MW AC.1 Blackridge’s list gives 333 MW with no AC or DC label.4 That matches Wikipedia’s DC figure for the site. The same Wikipedia table shows how easily the columns cross. It gives New England Solar 520 MWac and 400 MWp, the reverse of every other project in the table that carries both figures.5 AEMO records New England Solar Farm at 400 MW AC.1
Boundaries cause the larger gaps. Blackridge describes Bungala Solar Farm as 275 MW across two subprojects.4 AEMO’s in-service ranking carries Bungala One Solar Farm at 135 MW AC.1 Limondale follows the same pattern. Blackridge gives 314 MWac, and AEMO’s entry is Limondale Solar Farm 1 at 230 MW AC.4 Both figures are AC, so units don’t explain the 84 MW gap. AEMO records the project as two sites. Limondale Solar Farm 2 is also in service, at 28.98 MW AC.1 The two entries total 258.98 MW AC, still 55 MW short of Blackridge’s figure.
Connection limits add a third number. Wikipedia records Tailem Bend Solar Power Farm in South Australia at 108 MWac and notes that AEMO limited it to 95 MW.5 Smaller gaps come from rounding in company announcements. FRV announced Walla Walla as a 300 MWac solar farm on 1 October 2025.6 AEMO records 304.3 MW AC.1
What changed since the April 2026 release?
In-service solar capacity rose 424.6 MW AC between AEMO’s April 2026 and July 2026 Generation Information releases, from 11,038.4 MW to 11,463 MW. Anticipated capacity fell 883.7 MW AC between the two releases. Committed* capacity rose 600 MW AC.1
| AEMO status | April 2026 (MW AC) | July 2026 (MW AC) | Change (MW AC) |
|---|---|---|---|
| In Service | 11,038.4 | 11,463 | +424.6 |
| In Commissioning | 1,567.5 | 1,707.3 | +139.8 |
| Committed | 1,631 | 1,356.1 | -274.9 |
| Committed* | 370.1 | 970.1 | +600 |
| Anticipated | 7,024.1 | 6,140.4 | -883.7 |
| Publicly Announced | 52,931.8 | 53,228.7 | +296.9 |
| All statuses | 74,562.9 | 74,865.6 | +302.7 |
Source: AEMO NEM Generation Information, April 2026 and July 2026. Changes computed by Glamdring Research.1
Total listed solar capacity moved by 302.7 MW AC. The larger shifts happened between classes. Status totals can’t show which sites moved; that needs the April release’s site rows. The July status totals sum to 74,865.6 MW AC, and the state totals sum to 74,865.7 MW AC.1
What the ranking cannot tell you
The release covers the National Electricity Market, so Western Australian and Northern Territory solar sits outside it. Wikipedia lists Merredin Solar Farm in Western Australia at 100 MWac.5 Blackridge lists the Australia-Asia PowerLink near Elliott in the Northern Territory at 6 GW, at the planning and approvals stage.4 Neither appears in AEMO’s NEM release.
AEMO’s field records rated capacity. Two sites with equal MW AC can generate different amounts of energy, and the release doesn’t rank output.
Entries with different names stay separate. Bulli Creek appears twice in the top 25: Bulli Creek Solar Farm at 774.9 MW AC and Bulli Creek Solar Farm (Trina) at 550 MW AC.1 The ranking treats them as two sites because AEMO names them as two.
Hybrid sites count only their solar rows. Battery and storage capacity at those sites belongs to energy storage research.
Statuses are a snapshot at 31 July 2026, checked on 28 September 2026. The ranking refreshes when AEMO publishes its next Generation Information release. Other Glamdring energy rankings sit in the research archive.
Frequently asked questions
Which Australian state has the most solar farms?
New South Wales has the most solar sites in AEMO’s July 2026 release, with 135 across all statuses against Queensland’s 118. It also has the most in service, at 5,458.3 MW AC. Queensland lists more capacity in total, at 29,994.6 MW AC, because its sites are larger on average.1
Who is Australia’s largest solar company?
AEMO’s release carries an owner for most sites. Glamdring’s ranking sums capacity by site, so it doesn’t total owners. Among the 25 largest in-service sites, ACEN Australia is the only owner named twice: New England Solar Farm and Stubbo Solar Farm, 800 MW AC combined.1 Neoen describes itself as Australia’s largest 100% renewables company. That is a company statement covering wind, solar and battery assets.2
Is Western Downs Green Power Hub still the largest solar farm in Australia?
On AEMO’s figures, Western Downs Green Power Hub is second. Its July 2026 entry is 400.8 MW AC in service, behind Wellington North Solar Farm at 436.8 MW AC.1 The project’s website calls it the largest operating solar farm in Australia and gives its size as 460 MWp, a DC figure.2 Compared on AEMO’s AC field, Wellington North is larger.
Does the ranking include rooftop solar?
The ranking counts the 350 solar sites listed in AEMO’s Generation Information release.1 Household rooftop systems aren’t sites in that release. Australia’s total is far larger: over 4.29 million solar PV installations reached a combined 45.1 GW by December 2025, according to Wikipedia.5
Sources checked
Company-owned pages establish what a company says. They do not prove a market conclusion. Each source is dated so readers can judge each claim.